Putting the "BS" in BLS
The health insurance metric in the CPI is now worthless
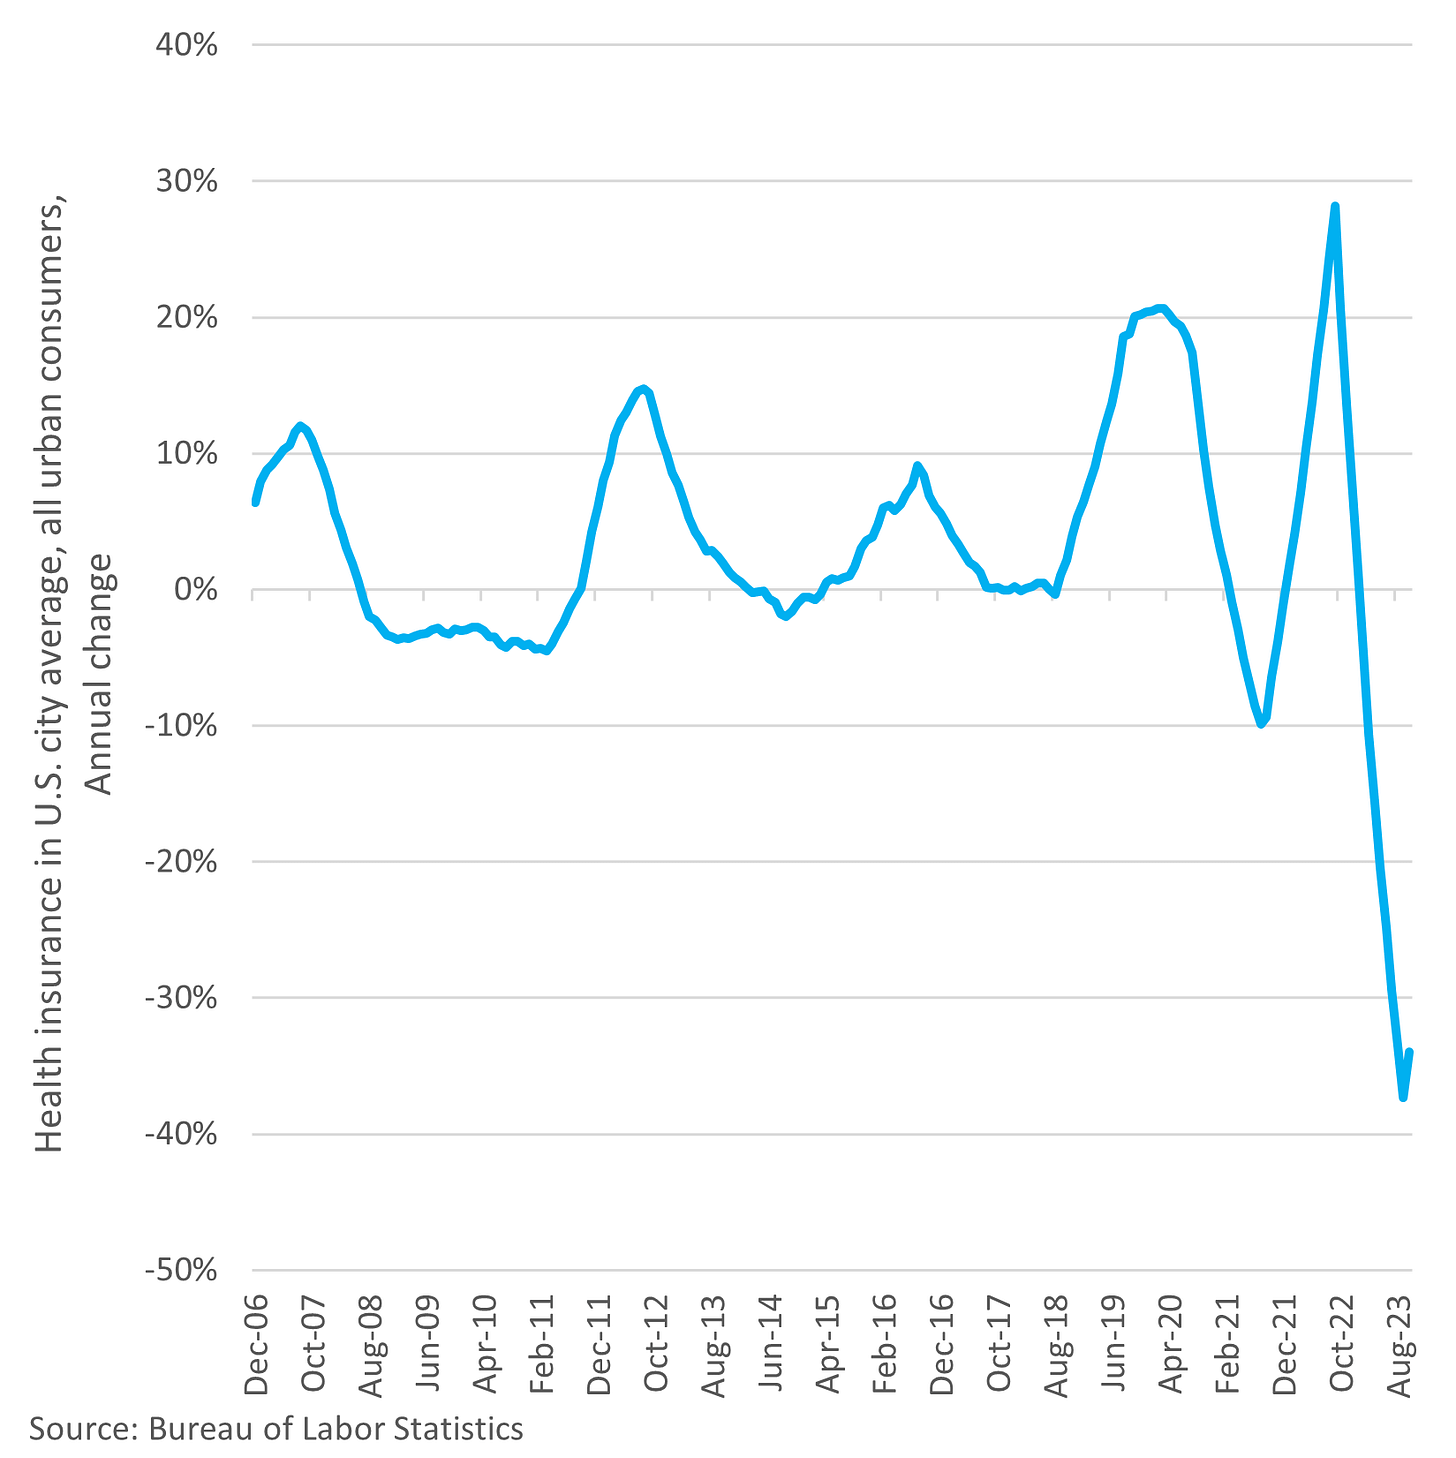
Plenty of people were surprised by the latest consumer price index (CPI) print which showed aggregate prices paid by consumers were roughly flat in the month of October. More surprising was the supposed 34 percent annual drop in the price of health insurance. You’d be hard pressed to find anyone whose health insurance costs went down over the last year, let alone down by a third. What makes this error so unforgivable is that the Bureau of Labor Statistics (BLS) has known about the problem for years.
Those who have been closely following the monthly CPI reports in depth have also known about the problem for a while. The reason it got more attention in the October report was because BLS made some methodological changes that took effect last month. Unfortunately, the changes BLS made (more on that later) did not address the underlying problems with their methodology of measuring price changes in health insurance.
To be fair, it’s surprisingly difficult to calculate the price of health insurance, because you’re trying to measure the “value added” and not what the insurance buys you. The latter would include medical care (like a doctor’s services) and medical commodities (like prescriptions). Those things are already accounted for in the CPI and, besides, they aren’t the product we’re talking about here. Health insurance is a different beast entirely. Most of what you pay in premiums just goes to providing predictable services and products, like an annual doctor’s visit. That’s not a function of insurance and is part of why health insurance in the US is so screwed up, but that’s a discussion for a future post. What’s important to understand here is that health insurance is a service providing coverage for unseen expenses, and that’s the part we’re trying to measure.
For example, if your health insurance expands to include coverage for a new drug that costs $100 a year and your premiums rise by $100 a year, then we don’t want to count that as an increase in the price of health insurance, assuming you are one of the people who are on this drug, in which case utilization changes. But this illustrates two things. First, health insurance is a product that changes regularly in terms of what it covers and who is using it, making frequent quality adjustments necessary. Second, the “pass-through” nature of health insurance means the premiums you pay are not a good metric.
What BLS is essentially trying to measure is the difference between what the insured pays in premiums and the value of the benefits he or she receives from the insurance. Let’s say you pay $5,000 per year in premiums, and you receive total benefits of $4,500 over the course of the year. The $500 difference is called net premiums, and BLS measures it by looking at the retained earnings of health insurance companies. This is an indirect method of measurement and it has some serious flaws because many factors can affect retained earnings besides premiums received and benefits paid.
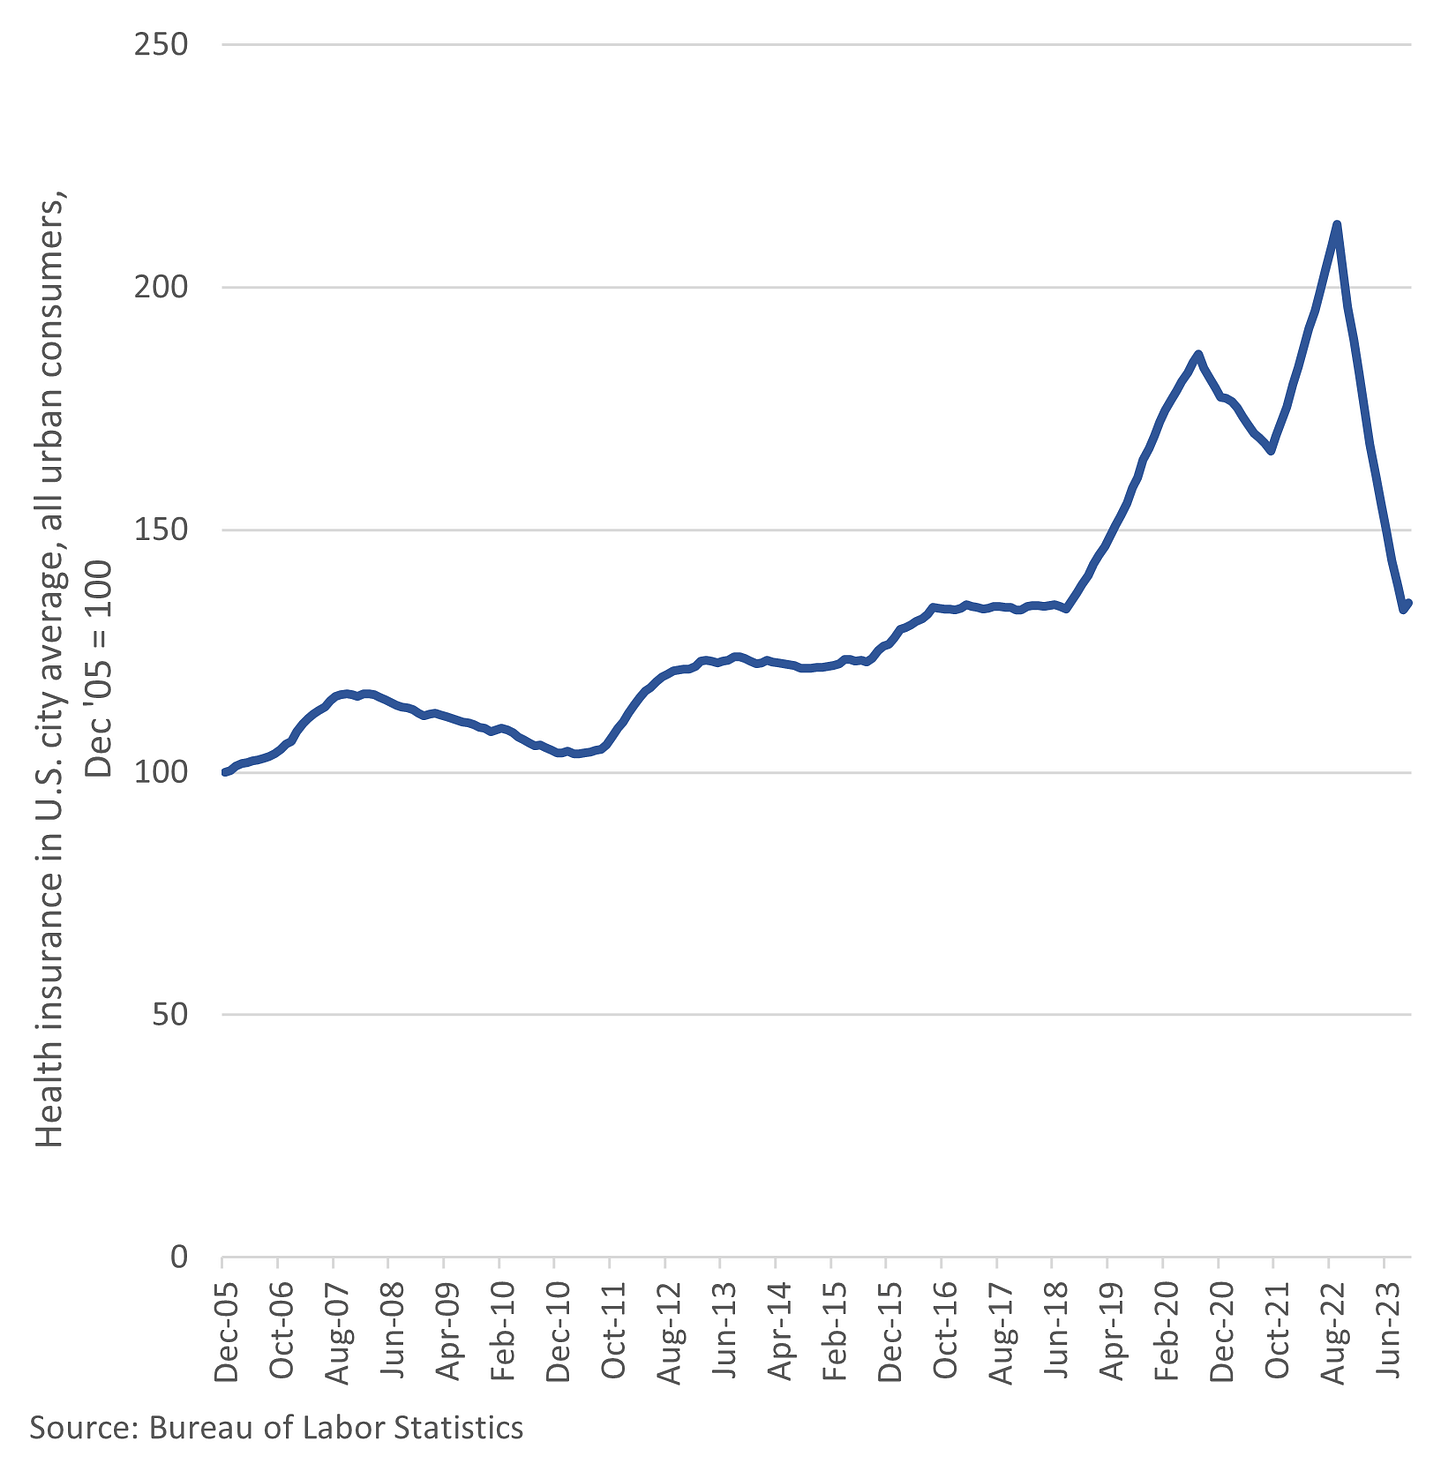
The problems with the methodology were evident long before covid, however. Each fall, depending on the latest retained earnings data, the price of health insurance in the CPI often began an abrupt change which then smoothed out over time. In the long run, this subindex provided reasonably accurate data. Even in the short run, the subindex usually did not deviate too far from reality. There was a two-year runup in the index preceding the pandemic, which was not unlike what happened in 2011 and 2012 in annual percentage terms. The big difference between the two time periods was that 2011 and 2012 came on the heels of three years of deflation in health insurance.
But by the fall of 2020, BLS incorporated the latest round of data, and it became clear that things were getting out of hand. (Cue the Dr. Strange gif…)
The subindex was set to plunge for 2021 because of a bunch of one-time flukes that were part of the government’s response to the pandemic, and that’s exactly what it did. To be clear, the change was not primarily due to a change in either premiums or the benefits people received, although utilization has fluctuated a lot the last several years. The violent changes in retained earnings were responsible for the equally violent changes in the index. By the fall of 2021, the trend reversed as retained earnings rose, and although this coincided with much higher insurance premiums, the subindex’s increase in 2022 slightly overstated the actual cost to consumers.
Several factors, including inflation which ate into the profit margins at health insurance companies, then combined to cause a collapse in retained earnings. Thus, retained earnings were falling even as consumers were paying significantly more for health insurance relative to the benefits they received. That meant the health insurance component of CPI was due to fall off a cliff despite people shelling out more cash.
And down goes Frazier. Down 37 percent in September of this year on an annual basis. That month, the subindex bottomed out at its lowest level since December 2017. Not surprisingly, since the incorporation of new data for the October reading, the cost of health insurance in the CPI has promptly reversed course but is still down 34 percent from last year’s high. And that doesn’t change the fact that the last 12 months of inflation data have been significantly underestimated by the flawed methodology. Of course, the preceding 12 months before that slightly overcounted their price increases, so on net, we have an undercount which will have to be made up for in the months (perhaps years?) ahead.
So, what changes did BLS actually make? Not very meaningful ones, clearly.
To prevent the sudden changes in the subindex’s level when new data are incorporated, retained earnings will use a moving average. To reduce the lag, the data is now updated twice a year instead of once a year. And that’s it. BLS is still using the retained earnings model as an indirect measurement of health insurance costs.
The fact that people at BLS knew this was happening and did nothing to correct it is beyond atrocious. Major policy decisions are made based on data like the CPI, and it needs to be balls-on accurate[1], or at least as close as possible. That’s why in 2020 BLS made a series of changes to unemployment data to better estimate how many people lost their jobs during government-imposed closures of businesses.
So, if such changes were made in 2020 during an unprecedented series of events, why was nothing done in 2021, 2022, or this year? That was an inexcusable oversight. Inflation over the last year has clearly been underestimated, giving the Federal Reserve an excuse to stop its rate hikes and to maintain only a slow rate of decline in the balance sheet.
In all fairness to BLS, the specific cost of health insurance is difficult to calculate, and direct measurement methodologies are arguably no better. It is hopefully already clear why simply measuring gross premium payments would be problematic. The failure here on BLS’ part is not so much that they are using an imperfect methodology but that they knew it was imperfect and did nothing to correct for a series of compounding errors that occurred right in front of their faces.
If this type of error happened at a private financial firm, literally everyone involved would be canned. And blackballed. Risk management would also be decimated. But because this is a government bureaucracy, nothing will happen. Actually, those involved may get promoted. That’s how you get the current Treasury Secretary.
[1] “Balls-on accurate” refers to the precise and consistent revolutions per minute of stationary steam engines when using mechanical governors in the 19th century. These devices had two to three large metal balls which were clearly visible spinning around a shaft, usually positioned above the main cylinder(s). The mechanisms were so much better than human operators at maintaining engine speeds under variable loads that a steam engine with these conspicuous balls on it became synonymous with consistency and accuracy. Thus, “balls-on accurate” originated as slang for the presence of a mechanical governor but was then applied to many other situations to describe a high degree of accuracy, particularly across varying circumstances.


Great article! I have owned a health insurance brokerage for 25 years now and have never seen a 34% decrease. I have seen a 200% increase statewide in individual premiums do to the Feds failing to provide the Risk Corridor “reinsurance” payment under the Affordable Care Act that were taxed to the American public, but never 34% decrease. Do you mind if I include your article in our client newsletter?